

This blog post describes how to use the Azure portal to automatically stop an Azure VM, if it is idle for a certain time, but without stopping it, when it was just started and hence the average idle time is below the set threshold.
For our data science projects we require virtual machines with lots of CPUs and memory, hence they are quite expensive. Typically, a program run is started during business hours, then runs for a couple of hours and then might finish during the night, after which the VM is idle. It would be nice to automatically stop the VM when it is idle for, let’s say, an hour, so that no further charges incur.
To achieve this, the way suggested by Microsoft is to create an alert rule with an upper threshold limit for the CPU percentage during the last hour that calls an automation runbook to stop the VM. This is nicely described in https://docs.microsoft.com/en-us/azure/automation/automation-create-alert-triggered-runbook.
However, the drawback is that when the VM is started again, and the alert rule happens to be evaluated e.g. five minutes after the start, then the average CPU percentage is likely to be below the threshold, because 55 minutes of the past 60 minutes the CPU percentage was zero. Consequently, the VM is stopped, which is clearly not desired. Increasing the execution frequency of the alert rule is no workaround, as there is no guarantee of when the rule is evaluated. Even if the frequency is set to an hour, it could still happen to be executed e.g. five minutes after the VM was started.
Another drawback is, that the standard metric for the CPU percentage uses the average over all CPUs. It is not uncommon, that in a program run there are phases with high CPU parallelization that alternate with phases where this is not possible and only one CPU is busy. Even if the one CPU is utilized to 100%, the overall average of many CPUs could be below the threshold configured in the alert rule and hence the VM is stopped prematurely.
It would be nice, if the VM metrics included the up-time. Then one could add a second condition to the alert rule that required the up-time to be longer than one hour. Another improvement would be the ability to base the CPU percentage not on the average of all CPUs, but on the CPU with the highest utilization.
This blog post describes how to access the up-time and to define a metric per individual CPU and how to use that information in an alert rule to stop a VM. The solution uses a Log Analytics Workspace that collects the up-time and individual CPU percentage. This log information is queried in an alert rule and based on the query result the VM is stopped via an automation runbook.
The involved steps are:
- Adding a metric for the CPU percentage per CPU of a VM
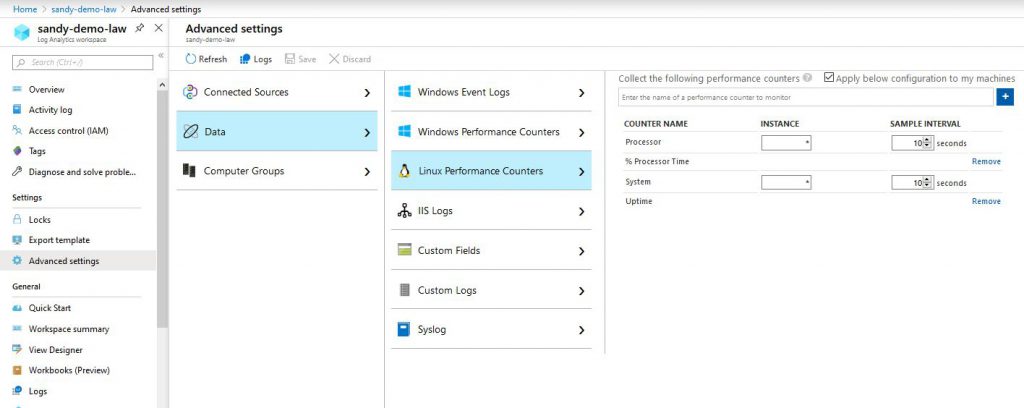
- Setting up a Log Analytics Workspace that captures the VM up-time.
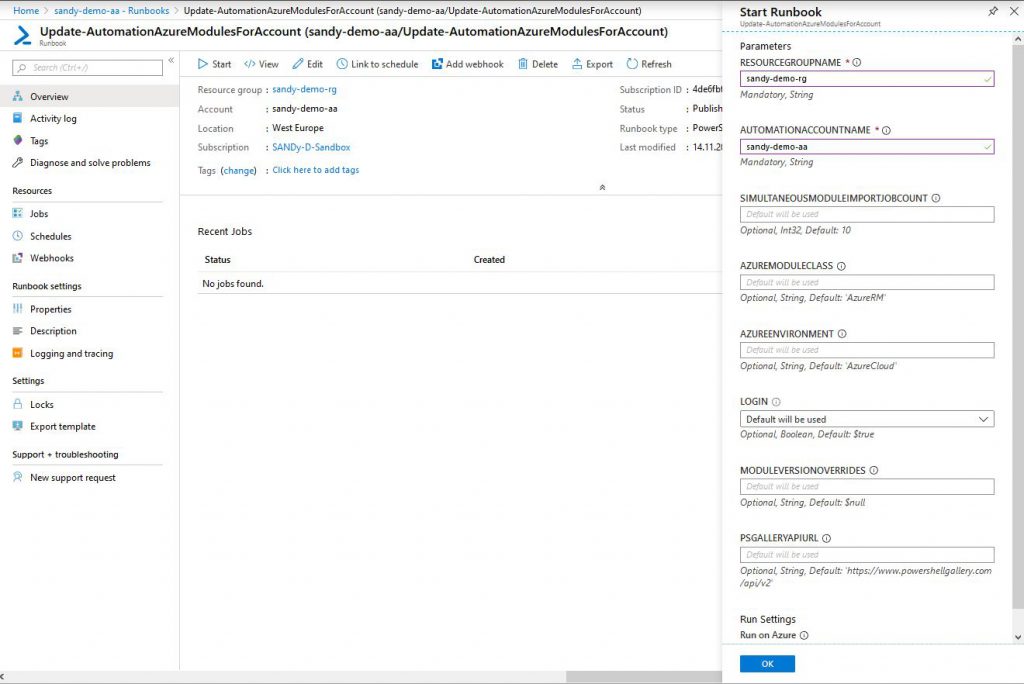
- Definition of an automation runbook to stop a VM
- Definition of an alert rule that evaluates the VM up-time and CPU percentage and calls the runbook
Here is a detailed description of those four steps. It is assumed that your Azure subscription contains already a resource group with a virtual machine in it.
1. Adding a metric for the CPU percentage per CPU of a VM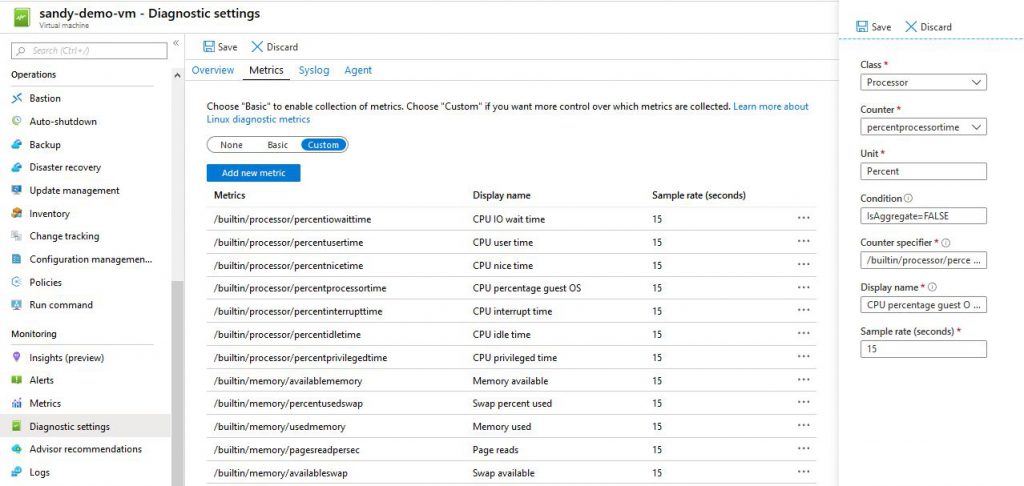
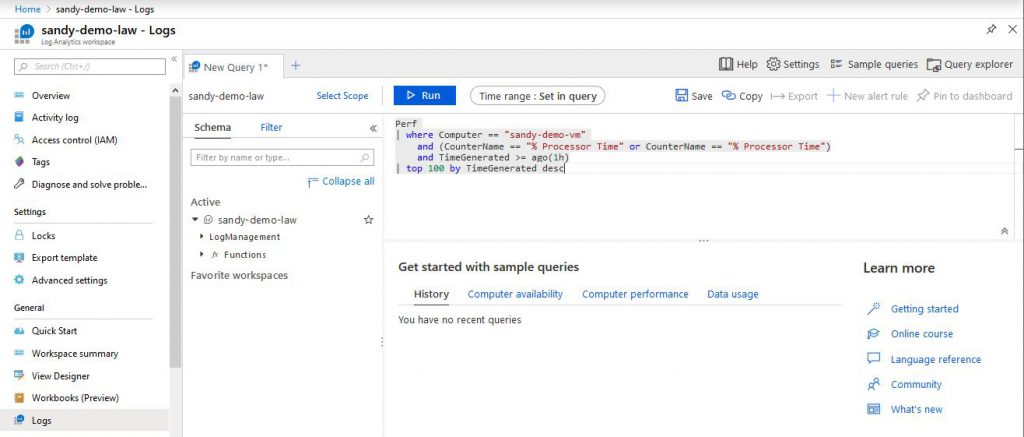
Now you can query the log events captured by the log analytics workspace. In the workspace select General -> Logs -> New Query. Under Schema -> Active -> LogManagement you can see the tables that you can query. The Perf table is the one that the processor time and up-time events get stored into. The queries use the Kusto Query Language. See the Learn more section next to the query box.
<#
.SYNOPSIS
This runbook stops a resource management VM in response to an Azure alert trigger.

.DESCRIPTION
This runbook stops a resource management VM in response to an Azure alert trigger.
The input is alert data that has the information required to identify which VM to stop.

DEPENDENCIES
- The runbook must be called from an Azure alert via a custom alert rule.

REQUIRED AUTOMATION ASSETS
- An Automation connection asset called "AzureRunAsConnection" that is of type AzureRunAsConnection.
- An Automation certificate asset called "AzureRunAsCertificate".

.PARAMETER WebhookData
Optional, so it can be used in an action group without having to specify the parameter,
as it is passed to the action by the alert rule.
Object with a RequestBody property which has as value a JSON string, which represents
a JSON object with the two properties schemaId and data.
The value of the data property is a JSON object with the search result table,
from which the VM data is taken

.NOTES
AUTHOR: Sandy Team
LASTEDIT: 2019-11-18
See also https://docs.microsoft.com/en-us/azure/automation/automation-create-alert-triggered-runbook
#>

[OutputType("PSAzureOperationResponse")]
param
(
    [Parameter (Mandatory=$false)]
    [object] $WebhookData
)
$ErrorActionPreference = "stop"

if (!$WebhookData) {
    throw "Missing WebhookData input. This runbook is meant to be started from an Azure alert webhook."
}

# From the WebhookData JSON get the RequestBody object, which contains a JSON string with the schemaId and custom data
write-output $WebhookData
if ($WebhookData.GetType().Name -eq "String") {
    # started from test pane where WebhookData is passed as string and not as object
    write-output "Converting WebhookData JSON string to object."
    $WebhookData = (ConvertFrom-Json -InputObject $WebhookData)
}
$RequestBody = (ConvertFrom-Json -InputObject $WebhookData.RequestBody)

# Check that the data comes from Log Analytics
$schemaId = $RequestBody.schemaId
write-output "schemaId: $schemaId"
if ($schemaId -ne "Microsoft.Insights/LogAlert") {
    throw "The alert data schema - $schemaId - is not supported."
}

# Get the info needed to identify the VM (depends on the payload schema)
$VmResourceId = $RequestBody.data.SearchResults.tables[0].rows[0][0]
$CpuPercentage = $RequestBody.data.SearchResults.tables[0].rows[0][1]
$UpSeconds = $RequestBody.data.SearchResults.tables[0].rows[0][2]
write-output "vmResourceId: $VmResourceId"
write-output "cpuPercentage: $CpuPercentage"
write-output "upSeconds: $UpSeconds"
$Parts = $VmResourceId.Split('/')
$SubscriptionId = $Parts[2]
$ResourceGroupName = $Parts[4]
$ResourceName = $Parts[8]
write-output "virtualMachineName: $ResourceName"
write-output "resourceGroupName: $ResourceGroupName"
write-output "subscriptionId: $SubscriptionId"

# Authenticate to Azure by using the service principal and certificate. Then, set the subscription.
write-output "Authenticating to Azure with service principal and certificate"
$ConnectionAssetName = "AzureRunAsConnection"
write-output "Get connection asset: $ConnectionAssetName"
$Conn = Get-AutomationConnection -Name $ConnectionAssetName
if ($Conn -eq $null)
{
    throw "Could not retrieve connection asset: $ConnectionAssetName. Check that this asset exists in the Automation account."
}
write-output "Authenticating to Azure with service principal."
Connect-AzureRmAccount -ServicePrincipal -Tenant $Conn.TenantID -ApplicationId $Conn.ApplicationID -CertificateThumbprint $Conn.CertificateThumbprint | write-output
write-output "Setting subscription to work against: $SubscriptionId"
Set-AzureRmContext -SubscriptionId $SubscriptionId -ErrorAction Stop | write-output

# Stop the VM.
write-output "Stopping the VM - $ResourceName - in resource group - $ResourceGroupName -"
Stop-AzureRmVM -Name $ResourceName -ResourceGroupName $ResourceGroupName -Force
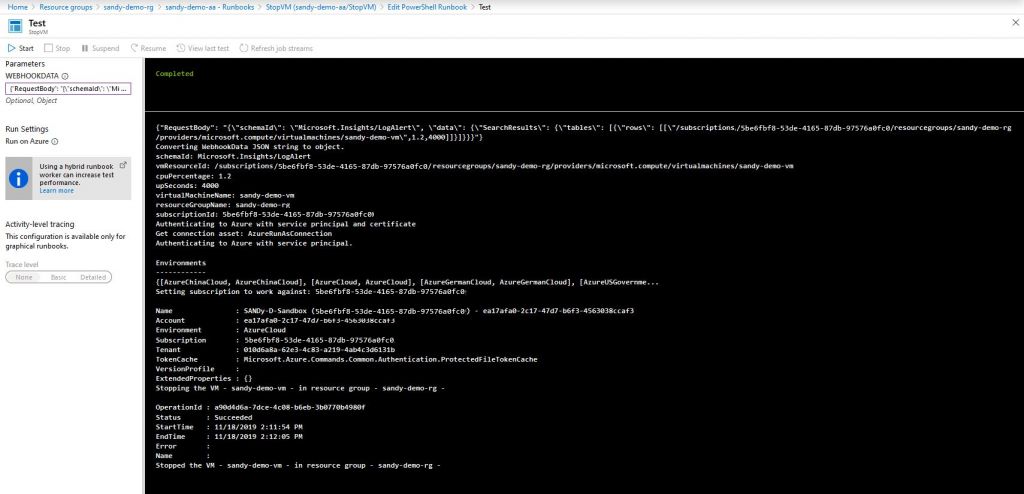
You can run and test the runbook in Edit mode via the Test pane. As input it needs a JSON document of the form:
{"RequestBody": "{"schemaId": "Microsoft.Insights/LogAlert", "data": {"SearchResults":
{"tables": [{"rows": [["/subscriptions/5be6fbf8-53de-xxxx-xxxx-97576a0fd7c0/resourcegroups
/sandy-demo-rg/providers/microsoft.compute/virtualmachines/sandy-demo-vm",1.2,4000]]}]}}}"}
It is a JSON document with the property RequestBody, which has as value a stringified JSON object with the two properties schemaId and data. Replace the subscription id, resource group and VM name with your own. When you run the script, it should stop your VM and display some debug output.
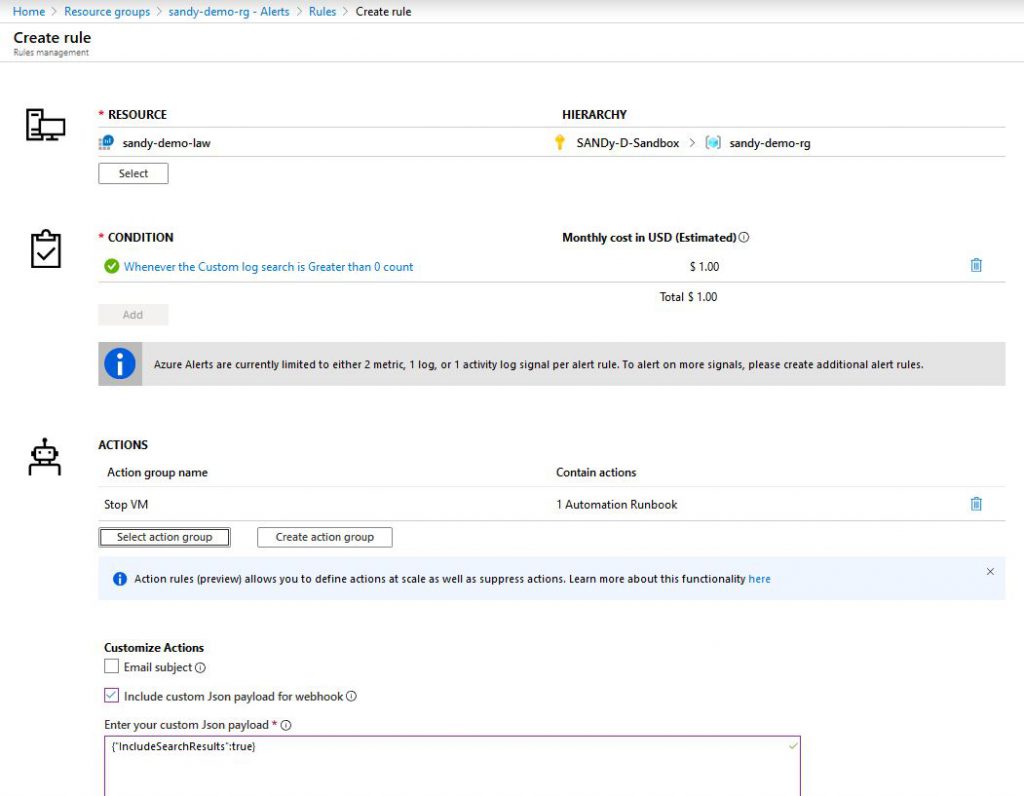
4.6. Enter your custom Json payload: enter the following JSON document: {“IncludeSearchResults”:true}
In the following Kusto query language script the value of the variable computerName needs to be replaced by your own VM name. The value for maximumAverageCpuPercentageOfBusiestCpu and minimumUpTimeSeconds can be adapted to your needs.
let computerName = "sandy-demo-vm";
let maximumAverageCpuPercentageOfBusiestCpu = 3;
let minimumUpTimeSeconds = 3600;

let minimumUpTimeSecondsAgo = datetime_add('second', -minimumUpTimeSeconds, now());
let averageCpuPercentageDuringMinimumUptime = toscalar( // is null, if no row is found, i.e. the VM is stopped for at least minimumUpTimeSeconds
Perf
| where Computer == computerName
    and CounterName == "% Processor Time"
    and TimeGenerated >= minimumUpTimeSecondsAgo
| summarize averageCpuTimePerCpu = avg(CounterValue) by InstanceName
| summarize max(averageCpuTimePerCpu)
);

let vmUptimeSeconds = toscalar( // is null, if no row is found
Perf
| where Computer == computerName
    and (CounterName == "Uptime" or CounterName == "System Up Time")  // on Linux or Windows
    and TimeGenerated > ago(10m) // if there is no log for the last 10 minutes, then the VM is already stopped
| top 1 by TimeGenerated desc
| project CounterValue
);

let vmResourceId = toscalar(
Perf
| where Computer == computerName
| top 1 by TimeGenerated desc
| project _ResourceId
);

// returns one row only, if the VM is still running and both conditions are true; otherwise returns no rows
print vmResourceId=vmResourceId, cpuPercentage=averageCpuPercentageDuringMinimumUptime, upSeconds=vmUptimeSeconds
| where cpuPercentage < maximumAverageCpuPercentageOfBusiestCpu  // null compared to a number evaluates to false
    and upSeconds > minimumUpTimeSeconds
The alert rule will run the Kusto query every 10 minutes. If the VM is either not running, or it is running, but for less than an hour or it is running, but the CPU percentage of the busiest CPU was on average above 3% during the last hour, then no row is returned by the query and no action is taken.
Otherwise one row is returned, which contains the Azure resource id of the VM, and the runbook is called with a WebhookData object as input. This is an object according to the Microsoft.Insights/LogAlert JSON schema (see https://docs.microsoft.com/en-us/azure/azure-monitor/platform/alerts-log-webhook). Due to {“IncludeSearchResults”:true} in the alert rule, the WebhookData contains RequestBody.data.SearchResults, which contains the one row query result. From that result the VM name, resource group and subscription id are extracted and they are used by the runbook to stop the VM.
The cost for the alert rule depends on its data source and execution frequency. E.g. an evaluation of the Log Analytics log every 10 minutes costs one dollar per month. A pure metrics alert rule costs ten cents per month.